Over the past two years, Bitcoin (BTC) has shown remarkable growth, increasing by over 300% since the beginning of 2023. In 2024 alone, Bitcoin surged by 40%, hitting a new all-time high of $73,750 in March. However, recent developments suggest that Bitcoin’s strong upward trend may face significant challenges in the coming months.
200-Day SMA Puts Bitcoin at a Critical Juncture
Crypto analyst Ali Martinez recently highlighted that BTC has dipped below its 200-day simple moving average (SMA), signaling a potential shift in price movement. The SMA is a commonly used trading tool that tracks price trends over a specific period, such as 200 days, to help traders identify market direction.
Read more: Hoskinson $1M Cardano Lace Wallet Security Challenge – Can You Hack It?
Typically, when an asset’s price moves above the SMA, it suggests an upward trend, while a dip below the SMA indicates a potential decline, triggering a sell signal. Despite this dip, Martinez suggests that Bitcoin’s drop below the 200-day SMA might be temporary and could present a buying opportunity for investors, supporting the notion that BTC could continue its bullish trend. However, if Bitcoin remains below the 200-day SMA for an extended period, it could signal the start of a bear market.
Bitcoin Price Snapshot
According to CoinMarketCap, Bitcoin is currently trading at $59,995, down 1.77% over the past week. This decline reflects the asset’s struggles over the last month, during which it lost over 8% of its value, briefly dropping below $50,000. Despite this, investor sentiment remains largely optimistic, with many expecting Bitcoin to be profitable in the long term.
Bitcoin is frequently predicted to reach six-figure valuations, driven by historical price trends, the potential approval of a Bitcoin spot ETF and possible shifts in U.S. government policy on digital assets. In the short term, Bitcoin’s next price targets are set at $62,000 and $70,000, both of which serve as key resistance levels.
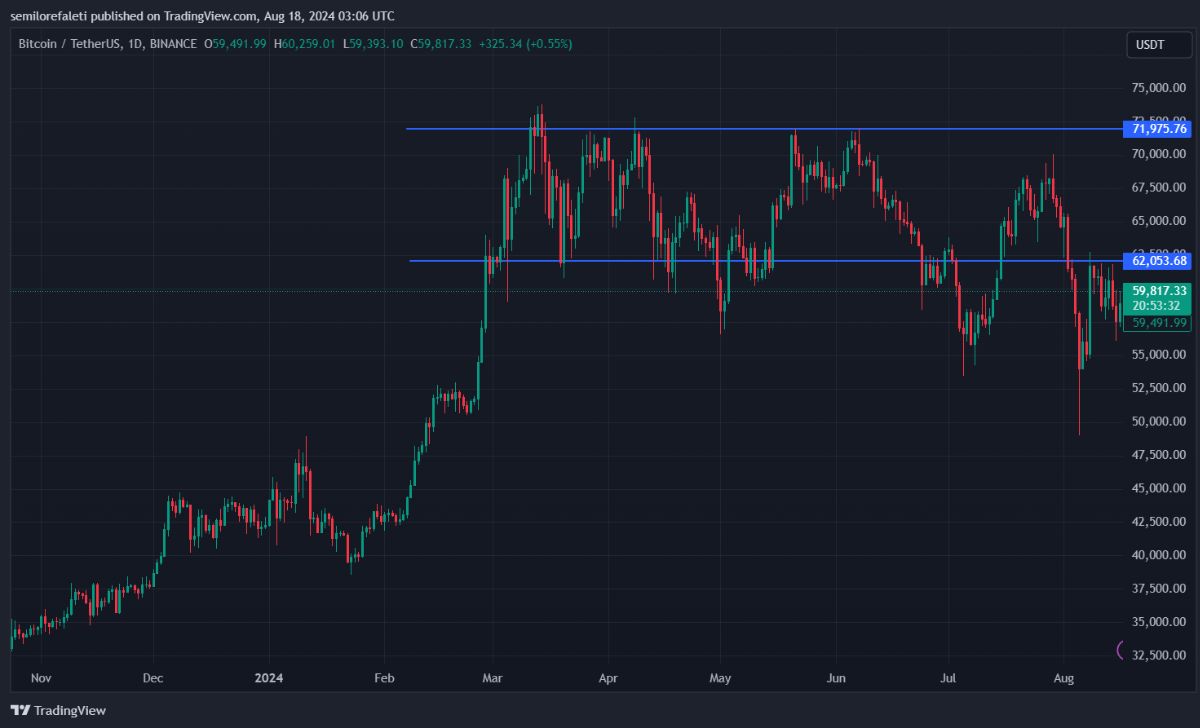
BTC trading at $59,817 on the daily trading chart
Cre: bitcoinist.

I’m Jessi Lee, currently living in Singapore. I am currently working as a trader for AZCoin company, with 5 years of experience in the cryptocurrency market, I hope to bring you useful information and knowledge about virtual currency investment.
Email: [email protected]